Sari la conținutul principal

ggplot2 Cheat Sheet

ggplot2 is considered to be one of the most robust data visualization packages in any programming language. Use this cheat sheet to guide your ggplot2 learning journey.
25 oct. 2022

Data visualization skills are table stakes for anyone looking to grow their R skills. ggplot2 is one of R’s premiere packages, as it allows an accessible approach to building robust data visualizations in R. In this cheat sheet, you’ll have a handy guide for all the functions and techniques to get you started with ggplot2.
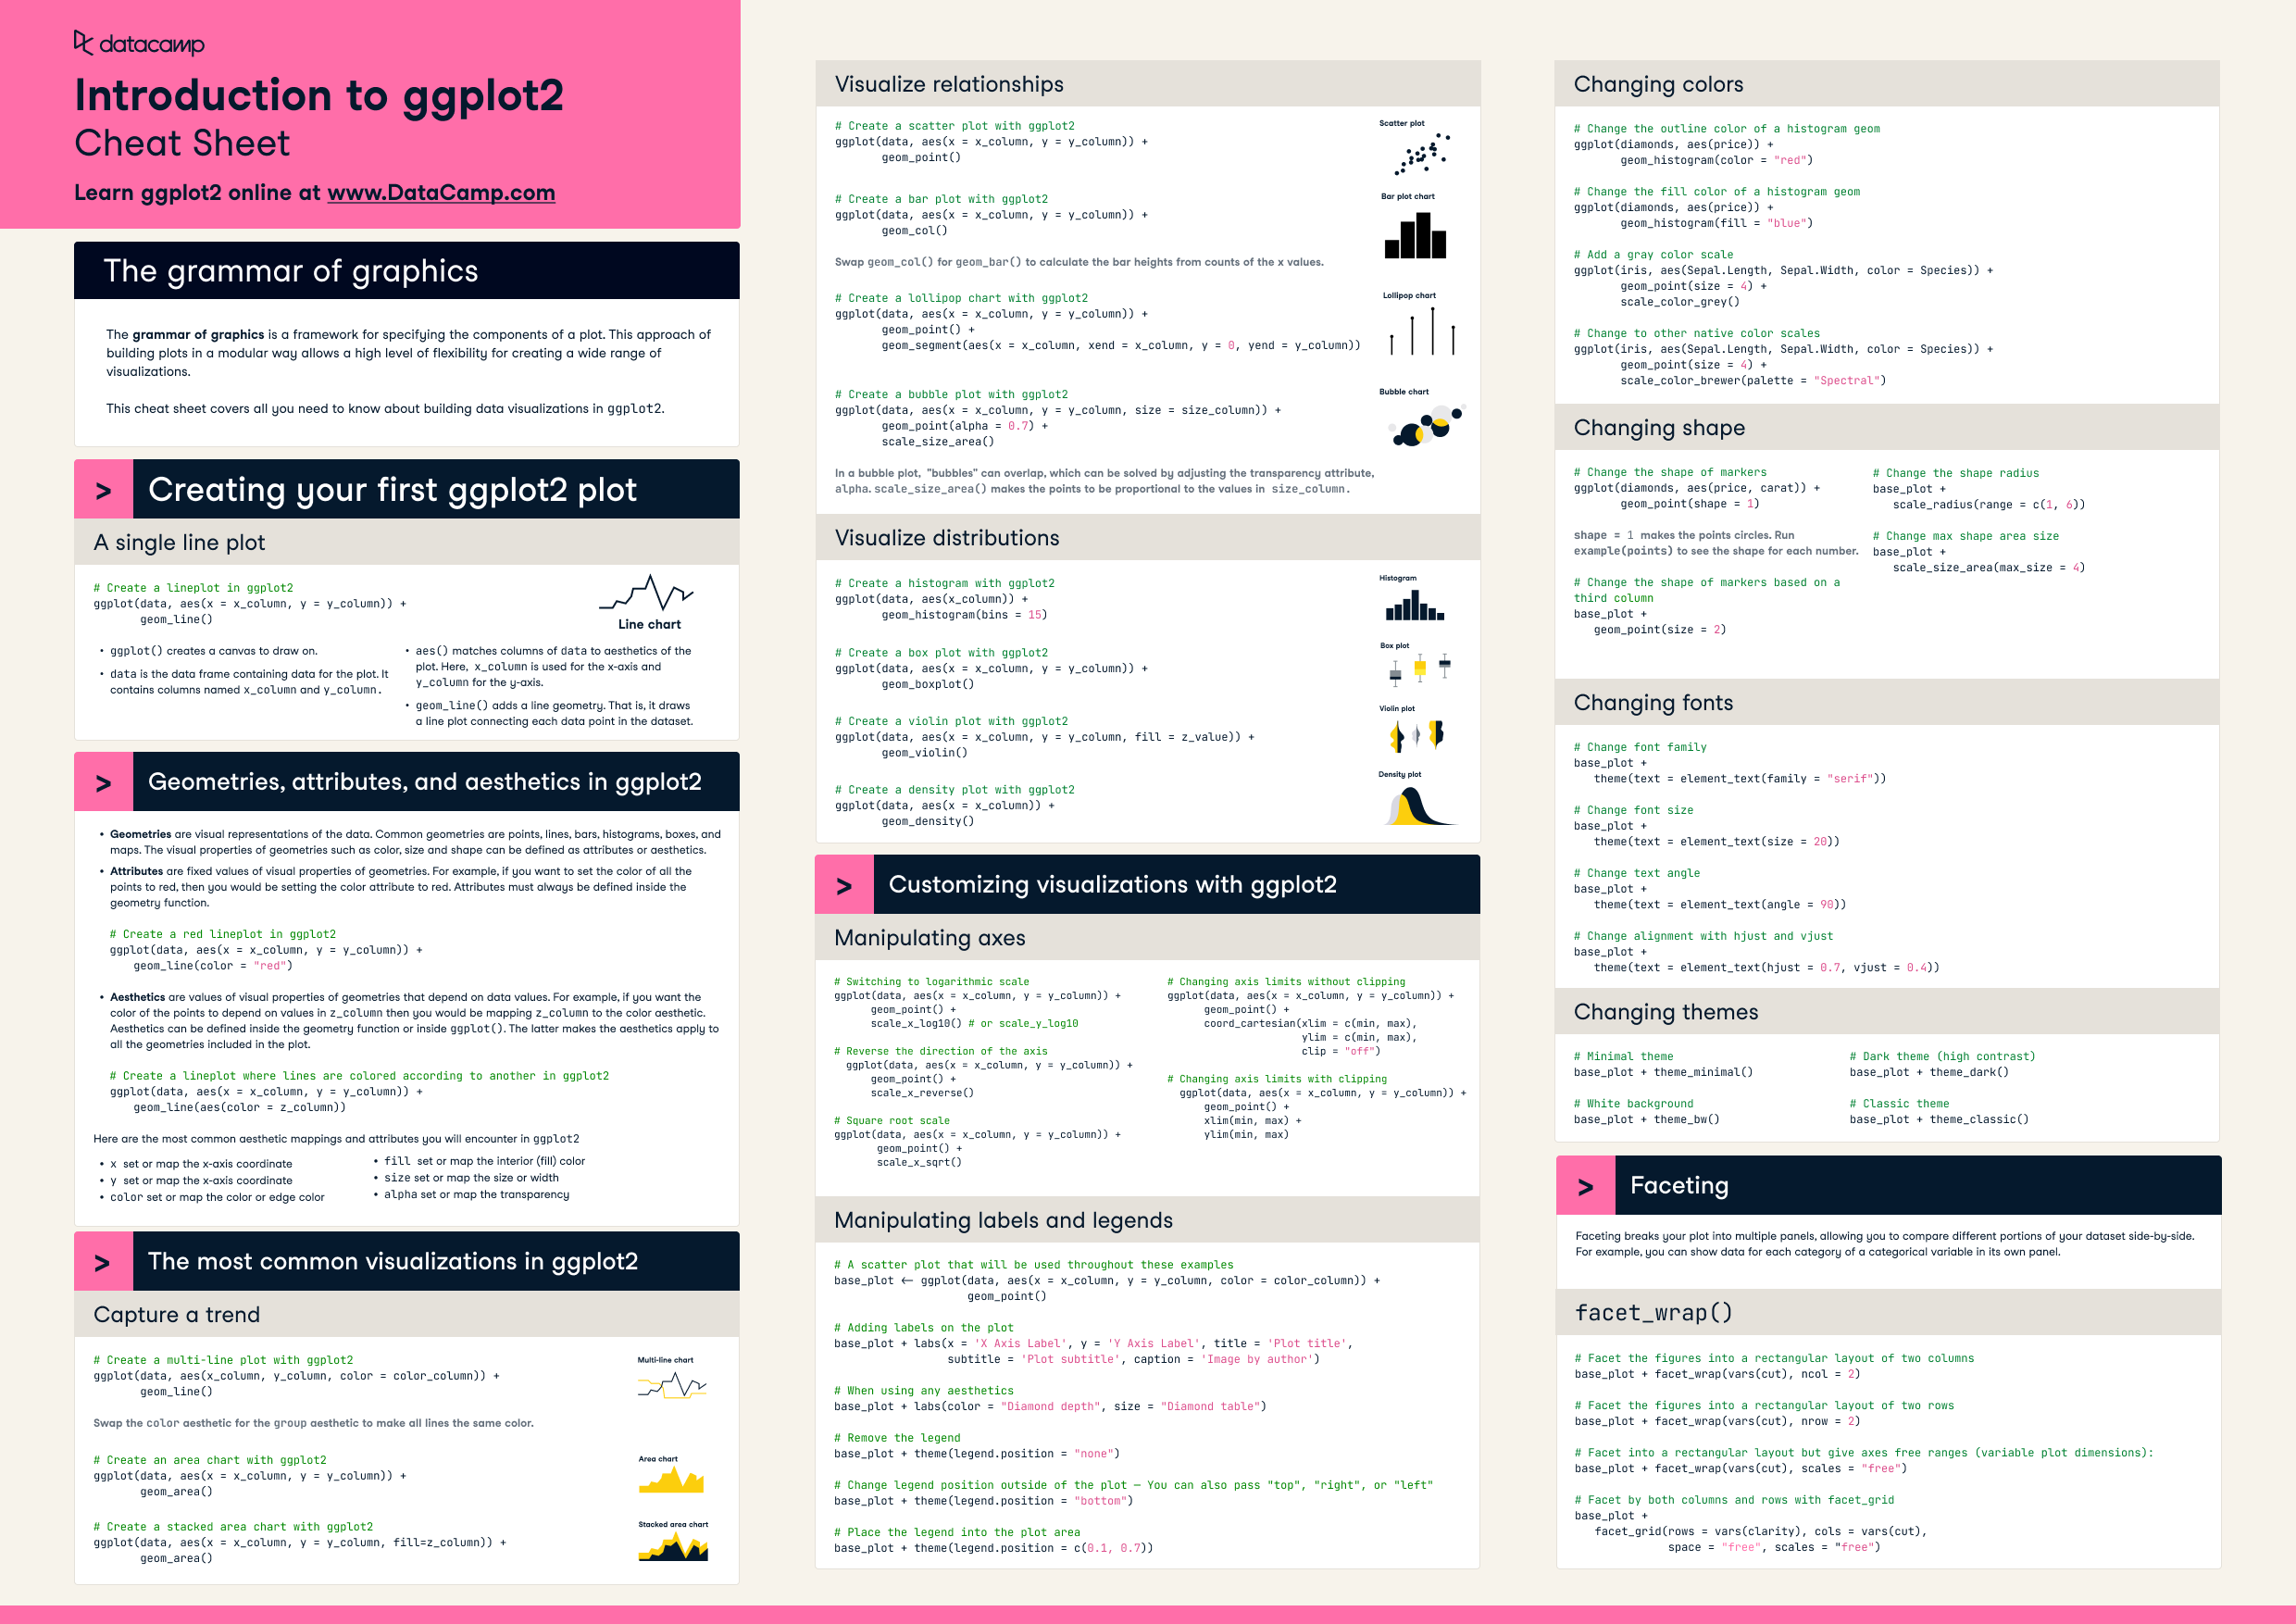
ggplot2 cheat sheet.png

Have this cheat sheet at your fingertips

Download PDF

The grammar of graphics

The grammar of graphics is a framework for specifying the components of a plot. This approach of building plots in a modular way allows a high level of flexibility for creating a wide range of visualizations. The framework can make plots easier to draw because you only have to declare what you want in the plot—the software, such as R's ggplot2 package, has to figure out how to draw it. This cheat sheet covers all you need to know about building data visualizations in ggplot2.

Creating your first ggplot2 plot

A single line plot

# Create a lineplot in ggplot2
ggplot(data, aes(x = x_column, y = y_column)) + 
       geom_line()
  • ggplot() creates a canvas to draw on. 
  • data is the data frame containing data for the plot. It contains columns named x_column and y_column.
  • aes() matches columns of data to the aesthetics of the plot. Here,  x_column is used for the x-axis and y_column for the y-axis.
  • geom_line() adds a line geometry. That is, it draws a line plot connecting each data point in the dataset.

Geometries, attributes, and aesthetics in ggplot2

  • Geometries are visual representations of the data. Common geometries are points, lines, bars,